Audio Production
Zero-order hold: pulse response and DAC reconstruction
Zero-order hold shapes DAC output through a rectangular pulse response. Understand desired-band droop, spectral images, filtering and the hold delay.
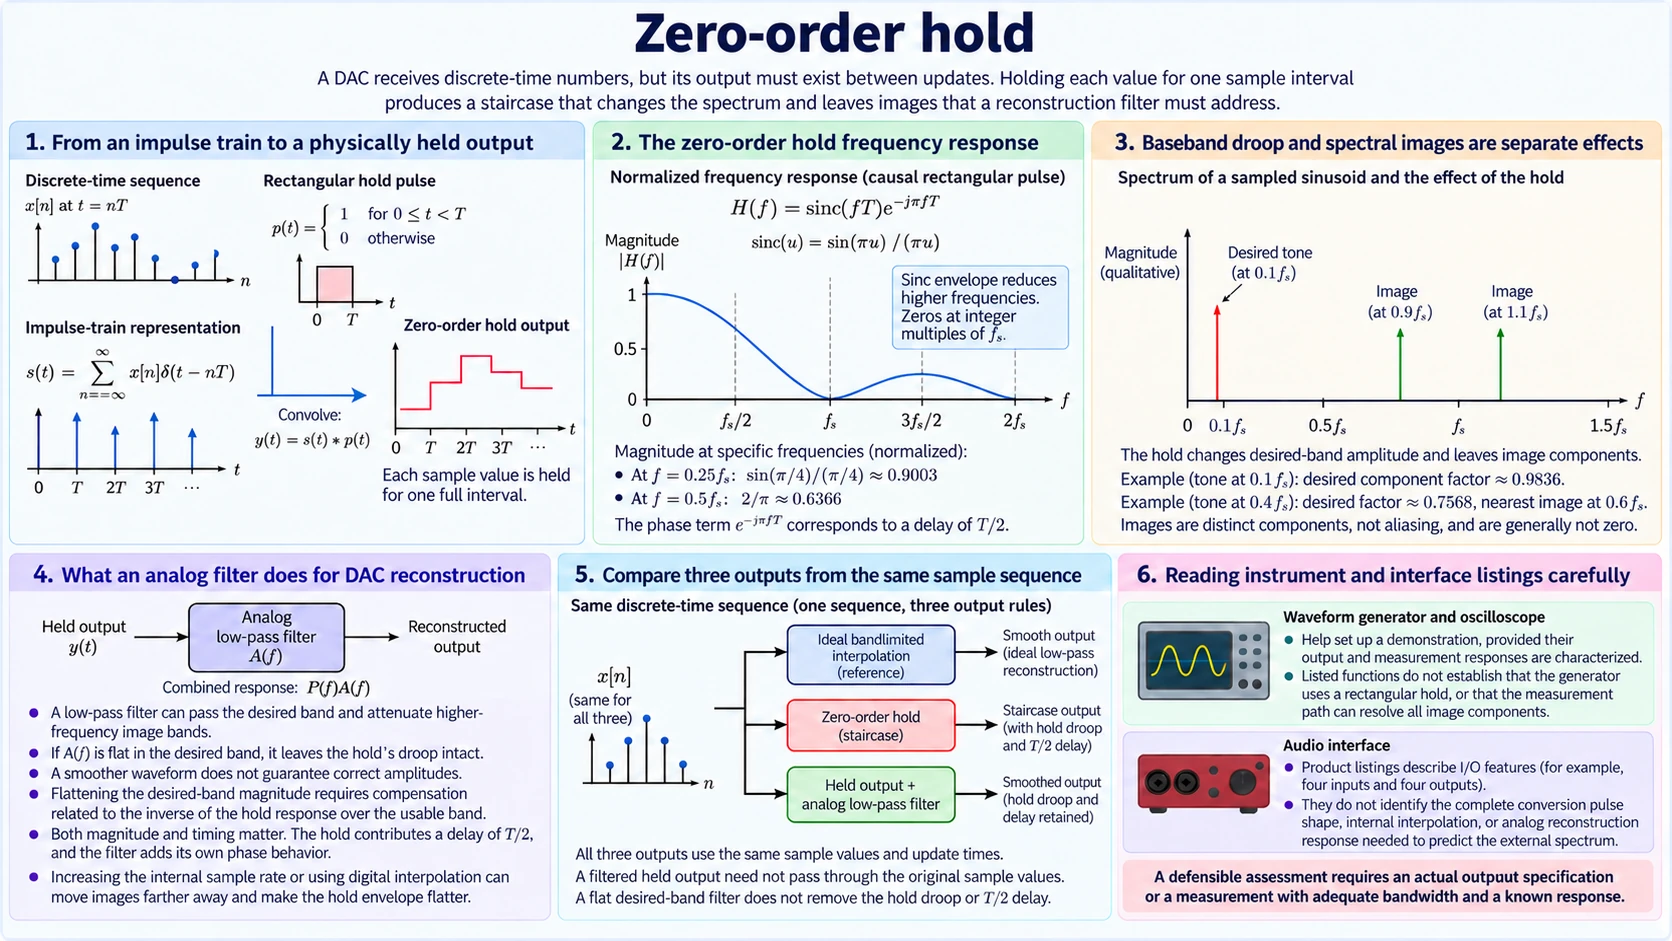
A digital-to-analog converter receives numbers at discrete times, but its output must exist between those times. One possible rule is to set the output to the latest sample value and keep that value until the next update. This rule produces a staircase and is called a zero-order hold. The flat sections are part of the conversion model, not evidence that the original signal contained flat sections.
Holding values changes the continuous-time spectrum. It shapes the desired low-frequency content and leaves copies of the sampled spectrum at higher frequencies. An analog reconstruction filter then acts on that held output. Understanding the two operations separately explains why smoothing a staircase does not, by itself, guarantee an ideal reconstructed waveform.
The following analysis assumes uniformly spaced samples, exact amplitude conversion, and a hold lasting one sample interval. It describes a mathematical conversion model rather than the internal architecture of every commercial DAC. Modern converters can perform digital interpolation, operate at higher internal rates, or use other output structures. Those implementations require their own transfer responses; the simple hold model remains useful when its assumptions are stated.
From an impulse train to a physically held output
Let the stored sequence be x[n], with sample interval T and sample rate fs = 1/T. A common mathematical representation places an impulse at each update time, weighted by its sample value. Written as s(t) = Σ x[n]δ(t − nT), this representation carries the timing and amplitudes of the sequence. An impulse has no finite width, so it is an analytical construction rather than the voltage waveform delivered to a load.
To represent holding, define a pulse p(t) that equals one from time zero up to T and equals zero outside that interval. Convolving the impulse train with this pulse produces y(t) = Σ x[n]p(t − nT). Each impulse becomes a rectangle with height x[n]. Adjacent rectangles fill the time axis, and the output changes only at sample boundaries. This is the defining operation of a zero-order hold.
The sequence and the output waveform are different objects. The same sequence could instead drive a different pulse shape or an ideal interpolation calculation. Knowing every x[n] therefore does not fully specify the analog output unless the conversion rule is also known. In this model, the pulse lasts T; changing that duration would change the response and would no longer be the stipulated full-interval hold.
Rectangular windows also appear in acquisition. The sampling-aperture guide describes how averaging modifies an input before reported measurements are available. That upstream effect differs from the spectral images considered here, which arise while already acquired samples form a continuous-time output. The common rectangle does not make the two operations interchangeable.
The zero-order hold frequency response
A rectangular pulse has a Fourier transform that can be calculated by integrating its complex exponential over the interval from zero to T. The result is P(f) = T sinc(fT)e−jπfT, where sinc(u) means sin(πu)/(πu), with sinc(0) defined as one. The factor T depends on the impulse-train normalization. When describing gain relative to the response at zero frequency, the normalized hold response is H(f) = sinc(fT)e−jπfT.
The magnitude is the absolute value of sinc(fT). The phase factor corresponds to a delay of T/2 for this causal rectangular pulse, within the frequency ranges where the sign of the sinc factor is handled consistently. A plot drawn with a centered rectangle would hide that causal timing offset. It would have the same magnitude envelope, but it would use a different time origin.
Within the desired band below fs/2, the normalized sinc magnitude decreases as frequency increases. At a quarter of the sample rate it is sin(π/4)/(π/4), about 0.9003. At half the sample rate the limiting magnitude is 2/π, about 0.6366. These are properties of the stipulated rectangular hold. They are not measurements of an audio interface or a statement that every finished DAC has this droop at its external connector.
The response has zeros at nonzero integer multiples of fs. That observation can be misleading when considered alone. A zero at exactly fs does not mean that every unwanted component near fs disappears. A spectrum contains bands around those multiples, and much of each band lies away from the exact zero. The pulse envelope reduces different frequencies by different amounts.
Baseband droop and spectral images are separate effects
The spectrum of a uniformly sampled sequence repeats at intervals of fs in the impulse-train representation. Applying the hold multiplies that repeated spectrum by P(f). The desired central copy is shaped by the sinc envelope, while the other copies remain under other parts of the same envelope. These repeated copies are the spectral images that output reconstruction must address.
Consider a hypothetical sinusoidal sequence corresponding to a continuous tone at 0.1fs. Its held output has the desired tone at that frequency and image components at frequencies such as 0.9fs and 1.1fs. The hold response reduces each according to its position on the envelope. The desired component has a normalized amplitude factor near 0.9836; the higher-frequency components are attenuated more, but they are generally not zero.
Now choose a desired tone at 0.4fs. Its desired-band factor is about 0.7568, and its nearest positive-frequency image lies at 0.6fs. The gap available between desired content and that image is much smaller. This example explains two different design concerns: desired-band amplitude shaping and the space available for an output filter’s transition. Neither concern can be described adequately by saying that the output simply needs its steps rounded off.
These examples assume the original sequence has the stated sinusoidal values and use an ideal mathematical hold. They do not concern spectral folding caused by reducing a sample rate. The unwanted content here appears at distinct continuous-time frequencies during output formation. Rejecting it can be an analog filtering task because it has not been stipulated to coincide irreversibly with desired-band content.
What an analog filter does for DAC reconstruction
Let A(f) describe the analog filter placed after the hold. The combined response to the impulse-train representation is P(f)A(f). A low-pass filter can pass the desired band while attenuating higher-frequency image bands. Its effectiveness depends on the desired bandwidth, transition width, rejection, and the response of the stages before it. Calling a filter a reconstruction filter states its role; it does not specify all those properties.
If A(f) is approximately flat in the desired band, it leaves the hold’s desired-band droop largely intact. The filter may produce a visually smoother waveform while the amplitudes of higher desired-band tones remain lower than those of lower-frequency tones. Smoothness in a time plot is not a gain specification. A waveform can look continuous and still have a frequency response that differs from the intended one.
To flatten the combined desired-band magnitude, a design can introduce compensation related to the inverse of the hold response over the usable band. That compensation might be digital or analog. Its design must include the rest of the converter path rather than assuming an isolated rectangle is the whole system. The intended bandwidth matters: a correction valid over one band should not be extended casually across hold-response zeros.
Timing also matters. A magnitude correction alone does not establish the phase response or total latency of the finished chain. The causal hold contributes its timing offset, and an analog filter contributes its own phase behavior. A specification for DAC reconstruction should therefore distinguish amplitude accuracy, rejection of unwanted content, and timing response. Improving one does not establish the other two.
Increasing the internal sample rate can move image bands farther from a fixed desired band and make the hold envelope flatter over that band. Digital interpolation supplies intermediate values for the higher rate. The polyphase-resampling guide traces an efficient calculation of those output samples, which is relevant to DAC reconstruction. Its execution schedule does not specify the analog filter or establish image rejection.
Compare three outputs from the same sample sequence
For a controlled comparison, start with one infinite sequence generated by a tone strictly below half the sample rate. Keep the amplitudes, update times, and sequence identical. Only change the continuous-time output rule. Using an infinite sequence avoids introducing finite-record edge effects into a comparison intended to isolate the conversion operation.
First, ideal bandlimited interpolation reconstructs a waveform using a sinc interpolation kernel under the usual bandwidth assumptions. For the stipulated tone sequence, it recovers that tone with the corresponding amplitude and phase. This ideal result is a reference model. Its infinite support and sharp spectral boundary are not a literal description of a finite physical circuit.
Second, a zero-order hold replaces each sample with a full-interval rectangle. The output passes through the stored values at the update boundaries according to its step convention, yet the desired sinusoidal component receives the hold response. The output also contains higher-frequency images. Agreement with sample values at specific times is insufficient to prove agreement between those times or agreement of continuous-time spectra.
Third, pass that held output through a stipulated low-pass filter. If the filter rejects the images but has unity magnitude throughout the desired band, the result approaches a smooth desired-band tone with the hold’s amplitude factor and timing still present. If the combined desired-band response is also compensated, it can approach the ideal reference within the stated design band. These are different filter specifications and should appear as different assumptions in the comparison.
A useful experiment or simulation therefore records more than the appearance of the trace. Compare the desired tone’s amplitude, its phase relative to the chosen time origin, and the remaining out-of-band components. Use the same reference for all three cases. Otherwise, an arbitrary plotting shift or gain normalization can conceal the very difference the comparison was meant to explain.
Reading instrument and interface listings carefully
A waveform generator and oscilloscope can help set up a demonstration, provided their own output and measurement responses are characterized. The ZT-703S combined oscilloscope, multimeter, and waveform-generator listing describes those instrument functions and waveform storage or export. Those listed functions do not establish that its generator follows the rectangular model used here, or that its measurement path can resolve all image components in a chosen experiment.
In an audio playback setup, the Focusrite Scarlett 4i4 fourth-generation recording bundle is listed with four balanced output connections and a USB-C interface providing four inputs. The output waveform still depends on the full conversion path. Neither the connector count nor the supplied recording equipment identifies the DAC pulse shape, internal interpolation, or analog filter needed to predict the external spectrum.
For either example, a defensible assessment needs an actual output specification or a measurement with adequate bandwidth and a known measurement response. The relevant questions are which desired frequencies must pass accurately, where the nearest unwanted output bands lie, and what combined response reaches the connector. The rectangular hold calculation supplies one clearly defined contribution to that analysis. It cannot replace evidence about the rest of the signal path.