Skills & Planning
Pooled median: why these subgroup summaries fall short
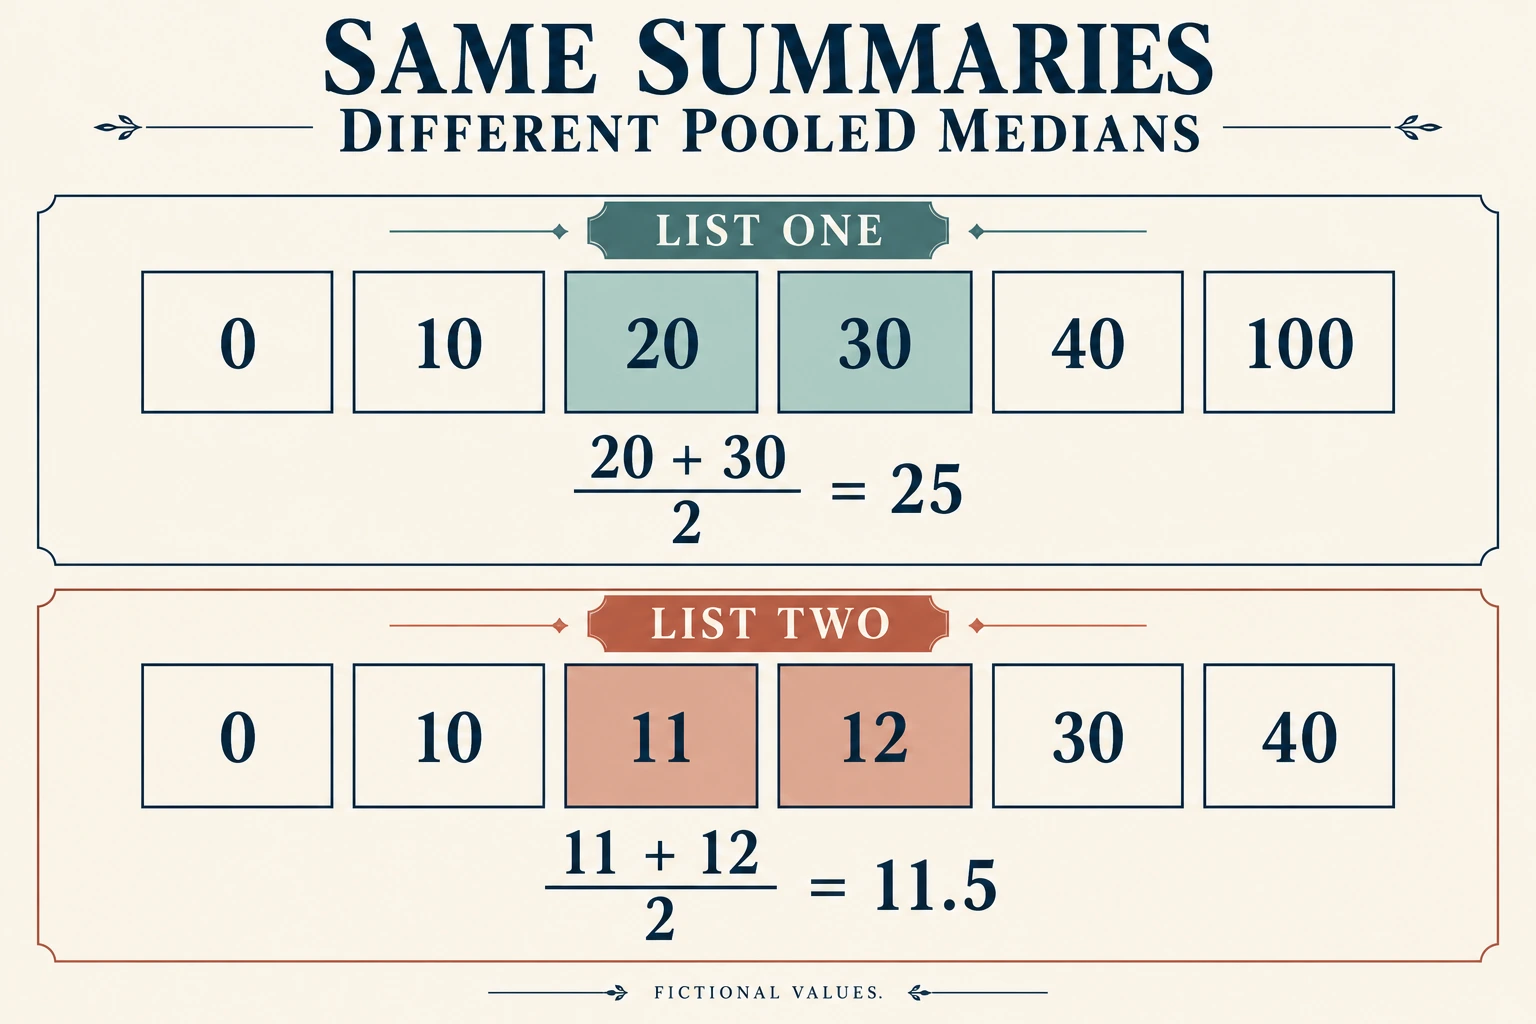
Two groups of three keep medians 10 and 30, yet two consistent pooled lists have medians 25 and 11.5. The counterexample identifies the missing central-rank information.
State the pooled question before calculating
Pooled median asks for the middle of all the observations after the groups have been combined and their values sorted. Suppose a fictional report gives just two subgroup summaries. Group A contains three observations and has median 10. Group B contains three observations and has median 30. The requested result is the median of the six observations together. These are invented numerical values, without a physical unit, product measurement or claim about any actual population.
A tempting answer is 20, halfway between the two reported medians. Before accepting it, ask whether the summaries determine which observations occupy the middle of the combined list. We will construct two complete datasets that both match the report. Their pooled medians will differ. Keeping the group sizes equal makes the test particularly direct: an unequal-size explanation cannot account for the missing information in this example.
Write the first complete dataset
For dataset one, let A contain 0, 10 and 100. Its three values are already sorted, so its second value, 10, is its median. Let B contain 20, 30 and 40. Its second value is 30, giving the other reported median. Each group has exactly three observations. Preserve all six values and their group labels in the working record before combining them.
Pool those observations and sort them in ascending order. The complete list becomes 0, 10, 20, 30, 40, 100. With six entries, positions three and four are the two central positions. They contain 20 and 30. Using the stated even-list convention, average those two central values: (20 + 30) divided by two equals 25. This is the pooled median for dataset one.
Audit the first sorted list against the group records: 0, 10 and 100 come from A, while 20, 30 and 40 come from B. Each value appears once. Exactly two entries precede 20 and exactly two follow 30, placing that pair in the center. In dataset two, 0 and 10 precede 11, while 30 and 40 follow 12. This rank check uses the actual complete lists. Merely confirming that each list has six entries would miss a copied value that accidentally replaced one of the original observations.
Check what the proposed 20 actually uses
Averaging the subgroup medians instead gives (10 + 30) divided by two, or 20. That calculation uses one selected value from A and one selected value from B. In the pooled list, those values occupy positions two and four. They are not the required central pair at positions three and four. The arithmetic division is defined; the problem is that its inputs do not identify the pooled middle.
Weighting those two medians by their group sizes does not repair this dataset. Three times 10 plus three times 30 equals 120, and dividing by the combined count six again gives 20. Equal group sizes make this weighted average identical to the ordinary average of the two medians. The correct pooled result remains 25. Counts alone have supplied no information about the missing rank occupied by the value 20.
Construct a second dataset with the same summaries
Now consider a separate dataset. Give A the values 0, 10 and 11, and give B the values 12, 30 and 40. A still has three observations and median 10. B still has three observations and median 30. Thus the original summary report is exactly the same for this dataset. No approximation, rounding or change of group size is involved in that agreement.
The sorted pooled list is now 0, 10, 11, 12, 30, 40. Its central positions three and four contain 11 and 12. Their average is 23 divided by two, or 11.5. Dataset two therefore has pooled median 11.5, although its two subgroup summaries match dataset one's. The proposed average of the reported medians is still 20, so it also fails to recover this second pooled result.
Track the changed values without merging the cases
Between the two datasets, A's upper value changes from 100 to 11, while its middle value stays 10. B's lower value changes from 20 to 12, while its middle value stays 30. Those changes preserve each group's middle position. They also alter which values occupy the central positions after pooling. The subgroup summaries do not describe these particular outer values, so the summaries can remain fixed while the pooled middle changes.
Do not put the values from both datasets into one larger list. They are alternative complete realizations of the same summary report, rather than twelve observations to combine. Label them dataset one and dataset two, retaining each group's three entries under its own label. A worksheet that silently mixes the cases would answer a different question and erase the counterexample we need to check.
Use the two results to test sufficiency
Any rule that receives only the original summaries receives the same input in both cases: A has count three and median 10; B has count three and median 30. Such a rule must give the same output when presented with that identical input. Yet the exact pooled answers are 25 and 11.5. One unchanged numerical output cannot equal both different values. Thus those summaries do not determine an exact pooled median in general.
This is a test of available information, rather than an arithmetic mistake hidden in one calculation. We exhibited full observations, checked their subgroup summaries and computed their pooled answers directly. Both realizations satisfy every initial condition. Selecting one as the intended dataset would require another condition that excludes the other. The report has supplied no such condition, and an aesthetically pleasing midpoint cannot supply it on the report's behalf.
Ask for the information needed by the ranks
If the full observations are available, retain their occurrences, combine the six entries, sort them and identify positions three and four. That procedure settles each of our complete datasets. When requesting records from someone else, specify which groups and observations belong in the pool. The number six here follows from two disjoint groups of three, with every observation counted once. A different population would require its own count and central positions.
The entire raw list is sufficient, but it is not the only possible adequate record. For this six-entry problem, a trustworthy identification of the actual third and fourth sorted values would also allow their average to be calculated. Such a record must genuinely concern the combined observations. Two subgroup medians merely labeled as central values do not become those pooled ranks. Ask what evidence establishes the claimed positions before using them.
Preserve occurrences and the stated median convention
Sorting orders observations; it does not remove repeated observations with the same printed value. If a later dataset contains two equal numbers, retain both occurrences when counting positions. Removing one would change the list length and potentially the central ranks. Our two worked datasets use distinct values to make every rank easy to inspect. Distinctness is a convenience of these examples, not a requirement that permits deduplicating somebody else's records.
Also record the convention for an even number of entries. This article defines its median as the average of the two central values, so 11 and 12 produce 11.5. Choosing only the lower central value would be a different definition. It would not justify reporting 11.5 as a transcription error. Establish the requested statistic and convention before comparing numerical answers from different worksheets or reporting systems.
Keep the conclusion bounded
The counterexample does not say that averaging subgroup medians can never happen to match a pooled median. It says the initial summaries cannot guarantee the correct exact result across all compatible datasets. A method's success on one selected list would need to be distinguished from a method justified by the available summaries. Here two compatible lists already suffice to defeat the proposed general reconstruction rule.
Nor does the report authorize an estimate of the missing observations. We have specified no probability distribution, sampling procedure or prediction task. Filling every A entry with 10 and every B entry with 30 would invent values beyond the supplied information. If the requested output remains the exact pooled median, record it as unresolved from the given summaries and request the needed rank information. Keep either worked dataset labeled as a hypothetical illustration.
Bound the optional clipboard accounts
The Universal document-box clipboard account shows a hinged silver box, top clip and integrated panels. Its two views do not authenticate maker, bundle quantity, material, dimensions, internal configuration or sheet-holding capacity.
The GF Zhong storage clipboard account shows six colored boards and an alternate black composite. A pictured pen is unconfirmed staging. Exact maker, model, supplied colors, dimensions, material and waterproofing remain unverified.
Neither account supplies the fictional observations or median proof. They provide optional paper-workspace context, and this exercise requires no purchase.
Leave other pooling and sufficiency problems distinct
The pooled ranking reversal guide compares binary completion fractions under different group mixtures and explicitly shared weights. Here group sizes stay fixed while unreported values change. The question concerns pooled middle ranks, without a ranking of routes or a common-mix comparison.
The underdetermined counts guide distinguishes a redundant scaled total from a new category-weighted equation. Our two realizations instead preserve subgroup medians and counts. They demonstrate missing rank information, without solving category-count equations or changing an integer domain.
Keep transaction enquiries separate from the lists
If you separately consider a clipboard order on republeq.com, assess the current offer and transaction before choosing how to pay. The observation values in this worksheet are invented mathematical inputs, not product quantities, prices or cryptocurrency instructions. Before using USDT, inspect the actual checkout and determine what that particular order presents. Check the requested amount and denomination, the receiving destination displayed, any network instruction, and the order status before sending funds. These are questions to resolve, rather than statements that an option exists for either offer. Confirm that the item and intended quantity match your proposed order. Resolve product and supplied-content questions separately from payment instructions. A photograph does not authenticate transaction terms. Keep the current instructions, their date and the result of any action you actually take, distinguishing a pending step from a completed payment. If the selection changes while you are checking, review the resulting transaction instead of carrying an earlier conclusion across automatically. Determine what the merchant currently supplies about delivery, cancellation and any refund process before relying on it. Do not assume a transfer can be reversed or a particular network will be supported. This conditional checklist makes no claim about token acceptance, transfer success or available remedies. You can complete the paper worksheet without buying either offer. A pooled list cannot authenticate a payment destination or show that an order has been accepted. The actual purchase needs its own clear and current order-specific evidence, and its records belong separately from this abstract exercise. Retain unanswered questions beside the proposed transaction.
Return the answer supported by the actual input
For dataset one, preserve the sorted list and its central 20 and 30, yielding pooled median 25. For dataset two, preserve its central 11 and 12, yielding 11.5. For the original report containing only subgroup medians 10 and 30 with counts three each, preserve the unresolved exact answer. The two complete realizations show why those summaries alone cannot select one pooled result.